
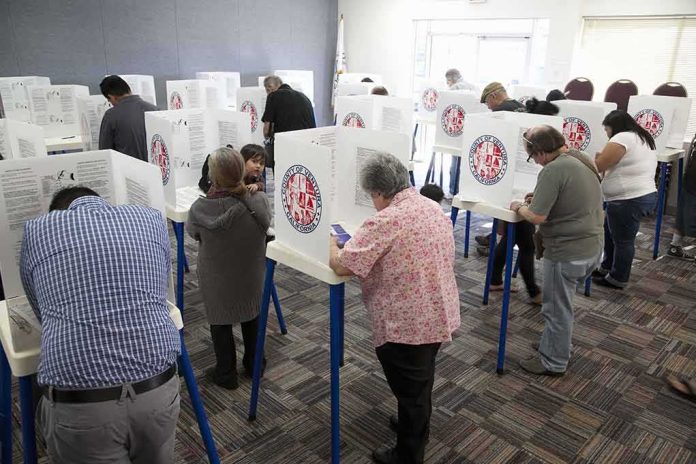
Midterms are often decided less by persuasion than by who actually shows up; in competitive House districts, the most reliable voters skew older, and in 2026 they told pollsters they were markedly more motivated than younger adults—an edge that, if converted to ballots, can override small advantages on the generic ballot.
At a Glance
- Across 43 competitive House districts, 83% of voters 50+ called themselves “extremely” motivated to vote, versus 66% under 50
- Older voters in these districts favored Republican congressional candidates 53%-43%, while younger voters favored Democrats 60%-34%
- The combined electorate in those districts leaned narrowly Democratic on the generic ballot, 49%-46%—making turnout composition decisive
- AARP used a bipartisan polling team and disclosed field dates, sample and error, enhancing methodological credibility
What the battleground poll actually measured
The AARP battleground survey focused on the universe that matters for House control: 43 districts rated Toss Up or Lean by the Cook Political Report, not a generic national sample. Among 1,368 likely voters interviewed October 1–5, 2026, the poll found a stark age gradient in self-reported motivation—83% of adults 50 and older described themselves as “extremely” motivated to vote, compared with 66% of those under 50. Because the overall ballot in these districts was close—Democrats 49%, Republicans 46%, 5% undecided—the shape of the electorate by age carries unusual leverage over outcomes in dozens of races decided at the margins.
Age in this survey was not merely correlated with motivation; it aligned with partisan preference. Voters 50+ favored Republican congressional candidates 53%-43%, while voters under 50 favored Democrats 60%-34%. If an older, more GOP-leaning cohort turns out at higher rates, it can offset or erase a modest Democratic lead on the topline ballot—a classic composition-versus-preference dynamic that routinely decides midterms.
Why the age gap matters mechanistically
Turnout is a two-step mechanism: motivation translates into action through registration, convenience (early vote, mail, accessible polling), and habit. Older Americans are overrepresented among habitual voters and those with stable residential histories, making it easier for campaigns to contact and mobilize them through voter files and proven GOTV scripts. A 17-point edge on a 0–10 motivation scale is not a direct forecast of turnout, but in tightly fought districts it is strong prior information about who will constitute the electorate—especially when aligned with clear partisan splits by age.
That linkage is visible in state-level corroboration. AARP’s Georgia survey, fielded earlier in the cycle, registered an even larger enthusiasm differential: 88% of voters 50+ at a 10-out-of-10 motivation rating versus 62% under 50. While Georgia is only one state, it illustrates the same directional pattern—older voters, higher stated motivation—under conditions where statewide contests and competitive House races put mobilization pressure on both parties.
The historical backdrop: structure favors older midterm voters
The 2026 snapshot sits atop a durable base rate: midterm electorates skew older. In 2022, adults under 50 were just 36% of voters but 64% of nonvoters, almost a mirror-image distribution that has recurred since 2018. Even when youth engagement surges, as it did in some recent cycles, the modal midterm participant remains above 50, which magnifies the influence of policy concerns that track with age—Social Security, Medicare, prescription costs, and retirement security—on the congressional agenda.
This structural tilt does not predetermine outcomes—coalitions evolve, local candidates matter, and younger voters have delivered decisive margins in college towns and growing metros. But the baseline composition of midterm electorates makes any measured enthusiasm edge among older voters especially consequential in competitive districts where a few thousand voters can flip control of a seat, and a handful of seats can flip control of the chamber.
Method, scope, and what the numbers can—and cannot—tell us
Several features of the AARP battleground poll deserve weight. The sponsoring organization retained a bipartisan team—Republican firm Fabrizio Ward and Democratic firm Impact Research—and disclosed essential parameters: field dates, universe, sample size, and margin of sampling error (about ±2.7 points). The survey’s scope—43 Cook-rated competitive districts—prioritizes the locales where marginal shifts matter most, rather than diluting the signal in safe seats with stable partisan baselines.
Two clarifications keep the findings in their proper lane. First, the 83%-versus-66% figure is a self-reported motivation measure collected weeks before ballots are counted; as AAPOR emphasizes, intention is an imperfect proxy for behavior, and likely-voter models try—but do not fully succeed—to bridge that gap. Second, because the poll is restricted to competitive districts, its inferences should be applied to the fight for the House, not to national popular sentiment or safe-seat dynamics. Within its stated universe, however, the combination of an older-voter enthusiasm edge and split partisan preferences by age is electorally meaningful.
Competing signals and why the district universe matters
Cycle-wide surveys can send different messages about “enthusiasm,” depending on how the question is asked and which electorate is sampled. A national University of Massachusetts poll in September 2026 found Democrats reporting higher enthusiasm levels than Republicans overall. That does not negate the battleground-district picture; it reflects a different denominator and a different lens. House control is decided in marginal districts, not in national aggregates—hence the value of targeting measurement to the places where small composition changes carry outsize consequences.
Media packaging can also blur distinctions. Some commentary has emphasized a “30-point” enthusiasm gap based on allied presentations; the AARP battleground release documents a 17-point difference on the “extremely motivated” measure. Regardless of phrasing, the takeaway that matters for strategy is stable: older voters in competitive districts reported higher motivation and leaned more Republican; younger voters reported lower motivation and leaned more Democratic. In a close race set, composition wins elections.
What makes a wave?
To me, the biggest unanswered question about the midterms is what happens to Republican turnout over the next 15 days, particularly among voters who have participated consistently in past elections.
At this point, the early vote data increasingly suggest that… pic.twitter.com/hgcqAENbNC
— Zachary Donnini (@ZacharyDonnini) October 19, 2026
Implications for campaigns and governance
For campaigns, the operational lesson is straightforward. Republican efforts that sustain high-contact programs with older voters—particularly around early vote windows and absentee procedures—compound an existing advantage. Democratic operations must either narrow the motivation gap among under-50 voters through targeted outreach and convenience voting or pick up additional share among older voters by focusing on cross-pressured issues such as drug prices and caregiving. Both parties ignore 50+ voters at their peril in competitive districts; they are both the most reachable and, by their own account, the most ready to vote.
Sources:
pjmedia.com, hotair.com, aarp.org, pewresearch.org, aapor.org