
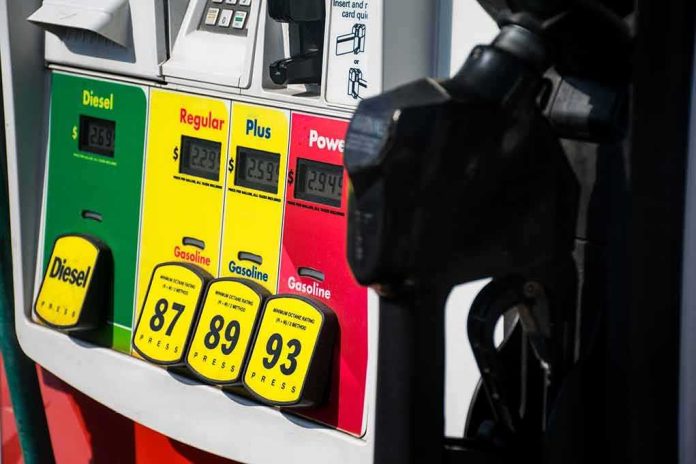
Labor Day 2026 marked a threshold moment at the pump: for the first time, the U.S. national average price for regular gasoline sat above $4 per gallon over the holiday, setting a new Labor Day record and reshaping how travelers budget late-summer driving.
The Short Version
- AAA said Labor Day’s previous high was $3.82 in 2012; 2026 broke it with the national average above $4.
- AAA’s holiday-weekend read put the national average around $4.14, the highest ever for this time of year.
- Independent coverage corroborated a break of the $4 barrier, citing a likely Labor Day average above $4.00.
- This is a holiday-specific record, driven by national averages; local prices varied widely by region.
What the record actually is — and what it is not
The claim is specific and straightforward: measured on the Labor Day holiday, the national average price for regular gasoline had never previously exceeded $4 per gallon. AAA’s holiday record book pegged the prior benchmark at $3.82 on September 3, 2012; in 2026, the national average was higher, clearing the $4 mark and setting a new Labor Day record. AAA’s public pricing note framed it plainly: the national average had never been above $4 on Labor Day until now. In its weekend summary, AAA put the national average around $4.14, reinforcing that travelers were facing the most expensive Labor Day at the pump on record.
That specificity matters. This is not an all-time record for gasoline — the industry has seen higher national averages at other points in the year — but it is a record for this holiday. It rests on a national average price that smooths vast local divergences: Californians and Hawaiians often pay far above the mean, while drivers in the Gulf Coast region frequently pay well below it. The point is the calendar anchor. On that anchor, 2026 set a new high-water mark.
How we know: the measurement sources behind the benchmark
AAA maintains a widely used daily national-average retail gasoline series compiled from station-level observations; its pricing desk is the reference most consumers and newsrooms cite when discussing day-specific records such as holiday benchmarks. For Labor Day 2026, AAA highlighted the prior high of $3.82 and called out that the $4 line had never been crossed on the holiday before — until this year. Its news page placed the weekend’s national average at roughly $4.14 and, after the holiday, still above $4, indicating the market held that level through the window travelers experienced.
Independent reporting tracked the same break of the $4 threshold. Reuters’ holiday coverage quoted a projection for Labor Day around $4.03, explicitly above 2012’s $3.83 prior record; that corroboration, while framed as a forecast ahead of the final day, aligned with the realized levels reported around the weekend. The methodological nuance here — the precise intraday snapshot AAA uses and the holiday-day clock — does not undermine the central point: the national average exceeded $4 during the holiday period, and the prior Labor Day record was lower.
Why Labor Day becomes a recurring “record” storyline
Holiday pricing turns into headlines because it intersects two reliable drivers: seasonal demand and public salience. Gasoline is one of the most visible household costs; when millions plan long road trips, a six- to ten-cent swing per gallon becomes dinner-table news. Data-wise, holiday comparisons are clean to communicate — you can anchor on a specific day and look back across years — which is why analysts and editors return to the Labor Day yardstick. The Energy Information Administration’s series shows how holiday-adjacent weeks fluctuate for structural reasons — refinery maintenance cycles, summer-blend transitions, and regional inventories among them — and why holiday records often differ from annual or monthly peaks.
It also bears saying what this record is not attempting to say. A Labor Day record does not claim systemwide dysfunction or policy failure; it is a calendar-bound reading of a national average. It does not tell you what your local station charged nor does it parse the contribution of crude prices versus refining margins on that day. Those are separate analyses; the holiday benchmark is a descriptive statistic, not a causal diagnosis.
Mechanics under the price: the levers that move a holiday average
Retail gasoline prices are the product of four principal components: crude oil, refining (turning crude into finished gasoline), distribution and marketing, and taxes. Crude sets the floor; when global oil trades higher — whether on supply discipline by major producers, unplanned outages, or geopolitical risk — pump prices drift up with a lag. Refining adds volatility: late-summer outages, hurricane threats along the Gulf Coast, and the switch between seasonal fuel specifications can tighten gasoline supply relative to demand, amplifying crude’s effect. Distribution and marketing costs are steadier but vary by region, and taxes explain a large share of the persistent price gap between states.
In 2026, coverage pointed to crude above $90 per barrel and heightened geopolitical tensions as the macro backdrop, which is consistent with higher retail prices into the holiday. AAA’s data captured the net effect: even after the weekend, the national average remained above $4, which signals that this was not a one-day anomaly but a sustained price level through the travel window.
Regional spread: why your experience may not match the headline
National averages mask dispersion. On the West Coast, stringent fuel specifications, limited in-region refining capacity, and higher taxes yield systematically higher retail prices; a Los Angeles driver can face numbers that look disconnected from the national mean. Local reporting around Labor Day 2026 documented that reality, with California among the highest-price states and major metro areas quoting regular gasoline well above $5 per gallon. By contrast, Gulf Coast states tied into abundant refining and lower fuel taxes often sat fifty cents or more below the national average during the same period. These regional skews do not contradict the record; they explain why some travelers felt a sharper sting than others.
The Philadelphia market offered a middle-case example: AAA’s city-level tracking had the region around $4.19, up meaningfully on both the week and the year, illustrating how East Coast markets with healthy logistics can still follow national momentum upward during a high-demand weekend.
Drivers returning home from Labor Day weekend trips are facing high gas prices across the Philadelphia region, with the national average for regular gasoline at $4.15 per gallon. NBC10’s @siobhan_mcgirl reports. https://t.co/F5hUVkLOYH
— NBC10 Philadelphia (@NBCPhiladelphia) September 7, 2026
What the Labor Day 2026 record means going forward
Three implications flow from a holiday record that clears a psychologically important round number. First, expectations reset. Consumers recalibrate what “normal” looks like at the pump heading into the post-summer shoulder season. Second, the policy conversation intensifies, fairly or not, because gasoline prices are a political accelerant; when the number begins with a four, pressure mounts on federal and state actors to scrutinize inventories, refinery reliability, and tax policy. Third, the data conversation should sharpen. AAA’s daily series and the EIA’s weekly retail price benchmarks complement one another; using both can separate calendar optics from trend behavior and give travelers, businesses, and officials a common reference frame for decisions.
As ever, durable relief at the pump rides less on one-day optics and more on fundamentals: crude supply, resilient refining capacity through maintenance seasons, efficient distribution, and an informed public that understands what a national average can and cannot tell them. On Labor Day 2026, the average told a clear story: the holiday was the most expensive on record for gasoline. Travelers lived it; the data confirm it.
Sources:
zerohedge.com, usatoday.com, nextgenauto.us, reuters.com, kttc.com, gasprices.aaa.com, eciks.org